The US Labor Market is Resilient, But is the Consumer Healthy? | Part 2
Signs of weakness with new rounds of layoffs, CEOs leaving at a record pace, consumer savings depleting, and non-mortgage debt service payments growing.

Note from David: I am excited to welcome back Amrita Roy of The Pragmatic Optimist, a Featured Publication on Substack, with her follow-up guest post on Quality Value Investing (QVI). Although QVI is a bottom-up microeconomic stock-picking service, subscribers should weigh the potential impact of socioeconomic, geopolitical, and technological forces on their investment portfolios. Thus, I am confident that readers will agree that The Pragmatic Optimist does just that as a complementary voice. Amrita, a global citizen who speaks seven languages, is a co-founder and investor of the ProjectM Fund and was a senior manager at two Silicon Valley startups. She has an undergraduate degree in physics from Bates College and an MBA from the University of Rochester’s Simon Business School. Please join me in welcoming back Amrita as a guest writer on QVI.
The Pragmatic Optimist is currently free to read. You can also tell Amrita you value her writing by pledging a future subscription.
Summary:
The US consumers’ willingness to maintain spending levels despite a slower economy and rising prices proved influential when many anticipated the potential onset of a recession.
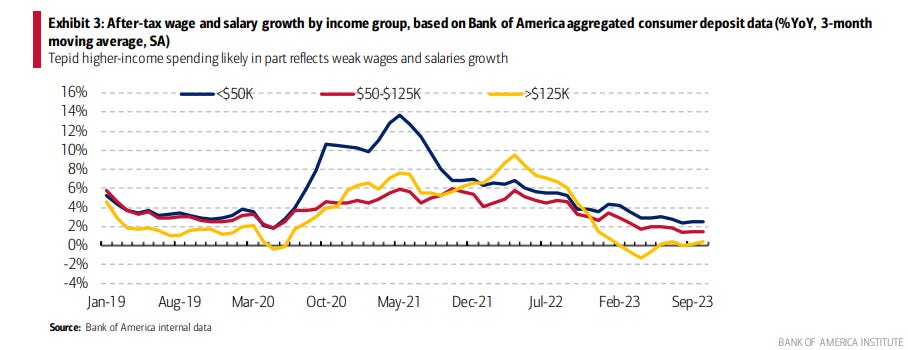
A strong labor market has buoyed the US consumer. However, the labor market is showing early signs of weakness, as the wage growth rate has peaked, and millennials and GenZs are increasingly seeking gig work to shield themselves against the rising cost of living.
Excess savings from the pandemic is almost over. It turns out that the low and middle-income households have withdrawn their savings much faster than the upper and upper-middle-income segments. At the same time, the lower-income segment has tapped into credit card debt at a rate that exceeds the pre-pandemic range.
While household debt balances have reached an all-time high of $17T, debt service payments relative to disposable personal income are not sending any economic warning signs. However, non-mortgage debt service payments are growing faster than usual and increasingly squeezing disposable personal income.
Read below to find out if the US consumer is healthy or about to catch a cold as we dig into the data and outline key indicators to watch.
For much of the last year, recession fears have been building up against a sharp rise in interest rates and market uncertainty. But to everyone’s surprise, the US economy has continued to defy the bold recession prediction (so far), thanks to a resilient labor market.
Remember, a resilient labor market equates to a resilient consumer. Consumer spending plays the most crucial role in driving the US economy, typically representing about 75% of total economic activity in the US. With non-farm payrolls growing at 1.9% and wages growing at 4.1% yearly, nominal consumer spending is growing at 5.3%. US retail sales increased by 1.6% in October, which was higher than expected, as households stepped up purchases of motor vehicles and spent more at restaurants and bars.
But how are US consumers funding their expenses? Are wages sufficiently high enough to cover all the expenditures? Or are consumers being forced to tap into their savings and take on additional credit card debt to cover the cost of living?
In this post, the second of two parts, we will assess the underlying financial health of the US consumer across the following dimensions:
Labor Market: Is it all that resilient?
Consumer Savings: Has the rise and fall of pandemic-fueled excess savings been even across all income groups?
Household debt: As household debt rises to record levels, will the US consumer be able to pay it back?
Let’s jump right in!
Learn more about Amrita Roy, The Pragmatic Optimist:
1. Are we starting to see early signs of cracks forming in the US labor market?
While nominal wages are growing faster than headline inflation, there are pockets of categories, such as rented and owned housing, where prices are increasing much quicker than wage growth. Remember, housing constitutes 33% of all consumer spending. This is taking place in an environment where wages are now growing at a much slower rate.
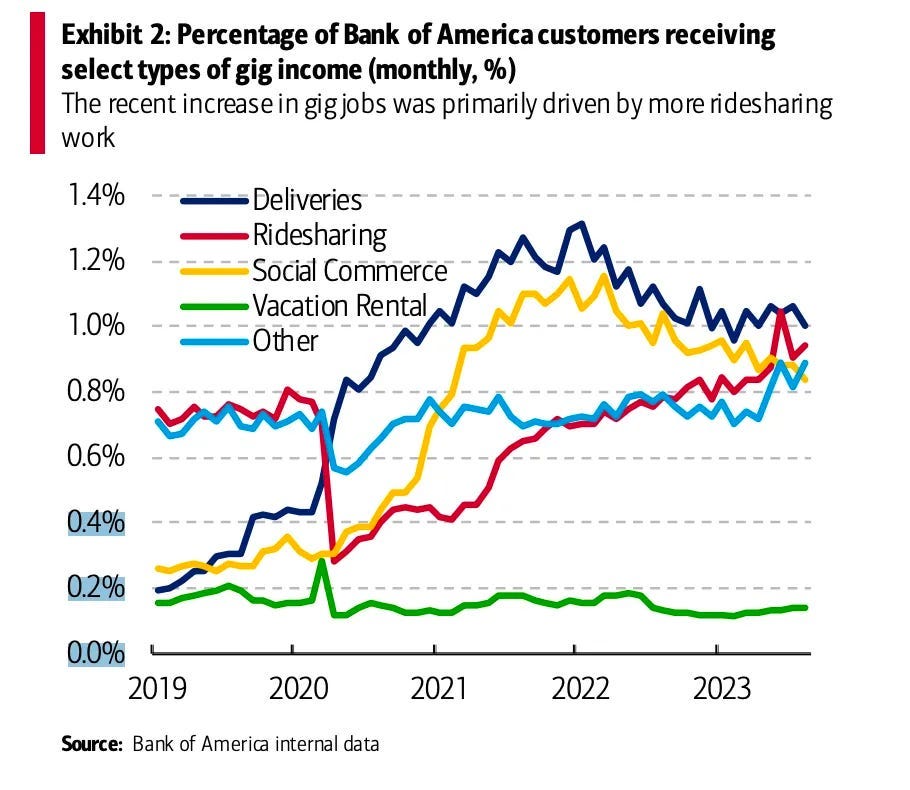
While this is a welcome sign for overall inflation to return to the Fed’s long-term 2.2% inflation target, the latest consumer report from Bank of America sees an uptick in gig jobs over the past few months. Specifically, the percentage of Bank of America customers who received income from gig platforms through direct deposit or debit cards reached 3% in August 2023, up from 2.7% in April 2023.
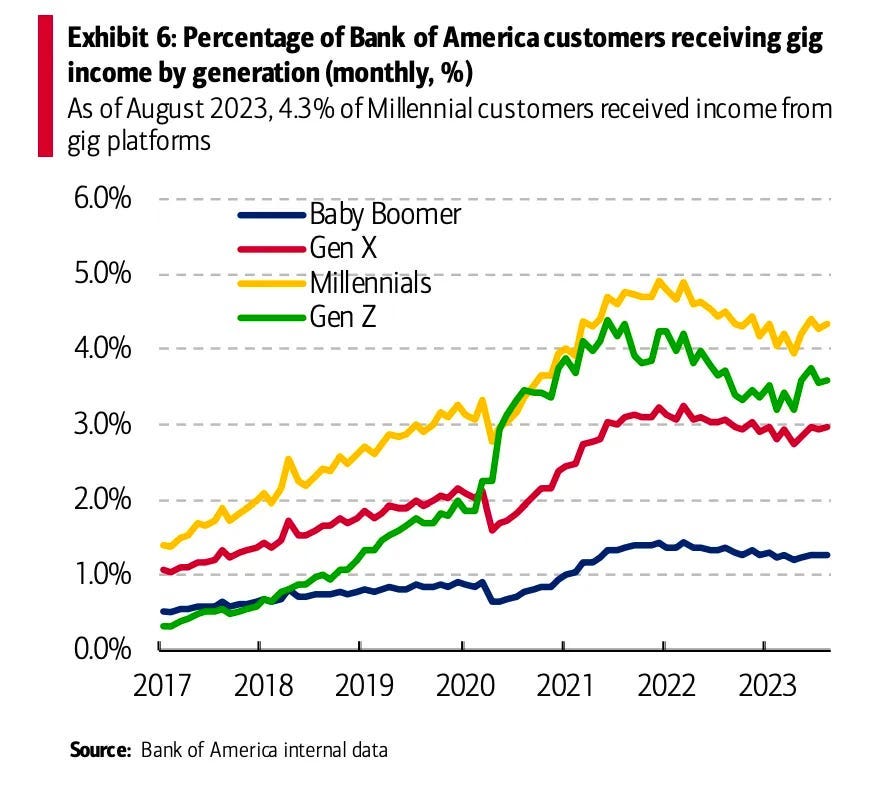
The increase in gig job participation seems driven by younger generations, with millennials continuing to represent the most significant cohort. As of August 2023, 4.3% of millennial customers received income from gig platforms. Next was GenZ, with 3.6% of customers seeing gig income inflows in August 2023.
With millennials set to represent 75% of the workforce by 2025 and GenZs fast on their heels as more significant numbers enter the workforce, they will increasingly define the majority of consumer spending.
Yet, millennials and GenZs are the most exposed to the rising cost of living, as they tend to move more frequently, either for work, to accommodate expanding families, or more broadly, as they seek more space as they age. Suppose this generation has to increasingly pick up multiple jobs to cover the cost of living. In that case, we might see a prolonged period of weak consumer spending if the labor market deteriorates further.
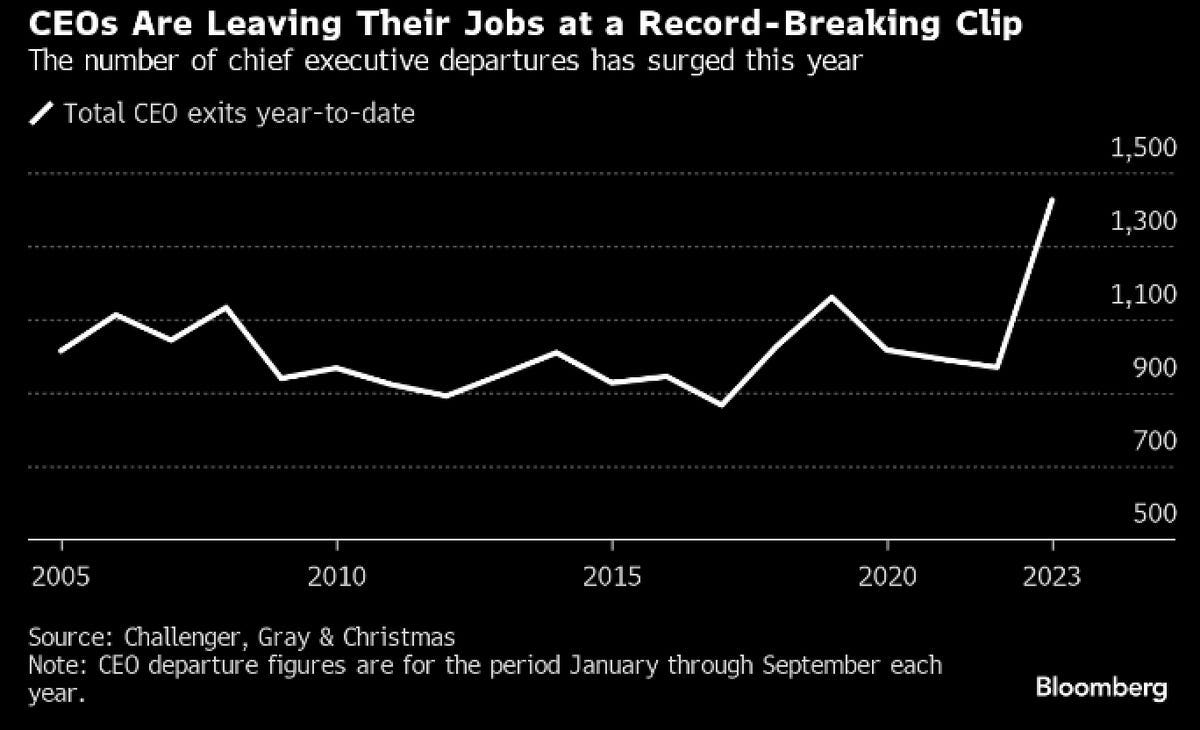
There were significant layoff announcements at companies such as LinkedIn, Flexport, Qualcomm, and others in October and November. At the same time, 1400 US CEOs have left their positions so far this year, up 50% on a year-on-year basis. This is the highest on record since tracking began in 2002.
In the meantime, US consumers have now mostly depleted the excess savings they had accumulated from a combination of fiscal stimulus and economic closures during the pandemic.
2. Is the rise and fall of consumer savings even across income groups?
Pandemic-related fiscal support resulted in a sizable increase in disposable income in the overall US economy at a time when health-related economic closures and social distancing led to a significant drop in household spending. As a result, aggregate personal savings rose rapidly, far beyond its pre-pandemic trends and much higher than in previous recessions.
The chart below shows a total of $2.1T in excess savings accumulated during the pandemic, which peaked in August 2021. After August 2021, aggregate personal savings dipped below the pre-pandemic trend, signaling an overall drawdown of pandemic-related excess savings. Since then, cumulative drawdowns have reached $1.7T as of September 2023, implying that approximately $430B in extra savings remain in the aggregate economy.
Should the recent pace of drawdowns persist, the first half would likely deplete the aggregate excess savings of 2024.

But are people from all income groups experiencing the same magnitude in the fall of savings?
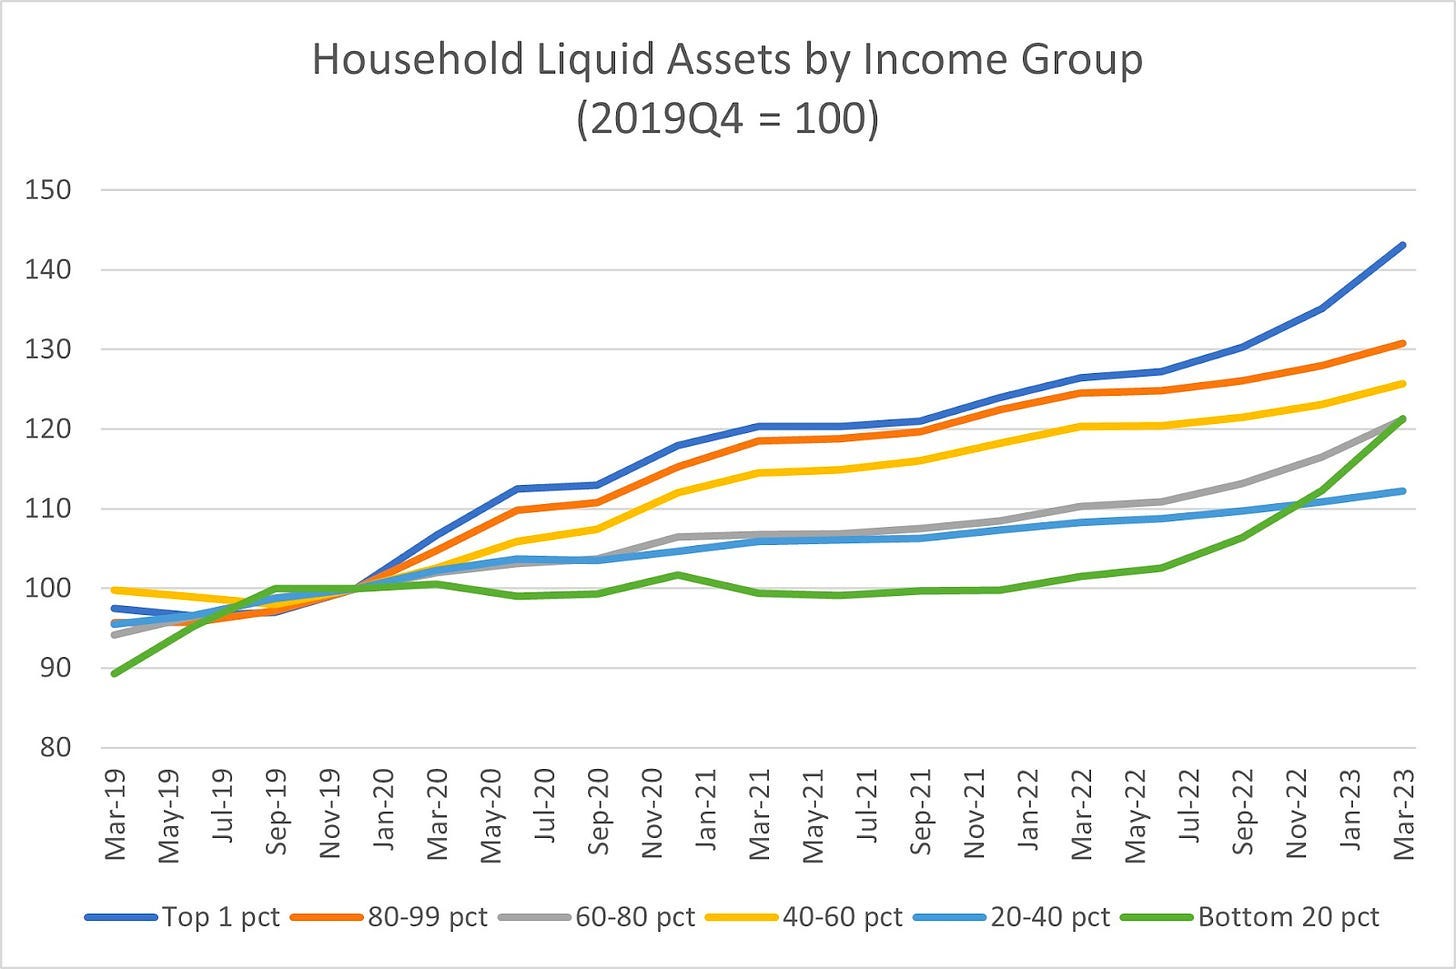
On June 16, the Federal Reserve Board of Governors released the latest Distributional Financial Accounts, where we find that household liquid assets (a measure of savings) generally remain elevated compared to pre-pandemic levels. Still, levels and trajectories differ across income categories.
Liquid assets are components of household net worth that can be easily converted to cash. It is the sum of deposits, government and municipal securities, and money market fund shares.
The chart below shows nominal liquid assets by household income groups (normalized to equal 100 in Q4 2019 as a pre-pandemic baseline). Across the income distribution, liquid assets have increased relative to the pre-pandemic baseline. The most significant increase accrued to the top 1% of households, where liquid assets are up more than 40% versus the pre-pandemic baseline. Lower and middle-income households (the 20th to 40th percentile of households) have seen liquid assets rise by 10% since the start of the pandemic.
Going one level deeper, when we look at the savings rate (liquid assets to income ratio) across income groups, we can see that the savings rate increased from 11.4% in Q4 2019 to 12.2% in Q1 2023 for upper-income households. For households with income in the upper-middle range, the savings rate has stayed at 5.3%. On the other hand, lower-middle-income households and lower-income households have seen their savings rate fall from the pre-pandemic levels of 4.6% to 4.2%.

This indicates that while the tailwind of excess consumer savings from the pandemic era is mostly over, it is the lower to middle-income households that have genuinely felt the brunt of inflation and high-interest rates over the past year and a half, as they had to rapidly drawdown on their savings, indicated by the decline in their savings rate to fund the rising cost of living expenses.
At the same time, consumers also tapped into credit card debt, which sits at an all-time high. In the next section, we look at the growth rate of household debt and interest payments relative to disposable personal income to see whether the rising debt level immediately threatens the overall consumer well-being.
The Pragmatic Optimist is currently free to read. You can also tell Amrita you value her writing by pledging a future subscription.
3. As household debt rises to record levels, will the US consumer be able to pay it back?
The prominent role consumers play in the US economy is one of the primary reasons why we should pay close attention to the state of household debt. In Q2 2023, total household debt in the US reached a record high of $17.06T. This represents a 5.6% increase on a year-on-year basis.
A quick primer on household debt
Total household debt consists of housing debt (70%) and non-housing debt (30%). Housing debt covers mortgages, while non-housing debt covers auto loans, student loans, and credit card balances.
While housing debt has grown 20% since the 2008 Great Financial Crisis, non-housing debt has grown 75% during the same period. The post-GFC era, marked by low-interest rates, was one of the reasons for the rapid increase in non-housing debt, whereas the housing market was still recovering from the shock during this period.
Credit card debt is rising amongst US households, especially for the lower-income segment
According to Rob Haworth, senior investment strategy director at the US Bank Wealth Management, consumers started 2022 in a solid financial position since consumer debt was low, savings were high, and people’s wages were rising. But Haworth said that by the end of 2022, the environment had changed, as consumer borrowing rose meaningfully, mainly in the form of unsecured revolving credit.
Total credit card debt topped $1T for the first time in Q2 2023, which had grown 16% yearly.
Remember, credit card debt is part of the non-housing debt portion of the overall household debt.

The Pragmatic Optimist by Amrita Roy is a Substack Featured Publication!
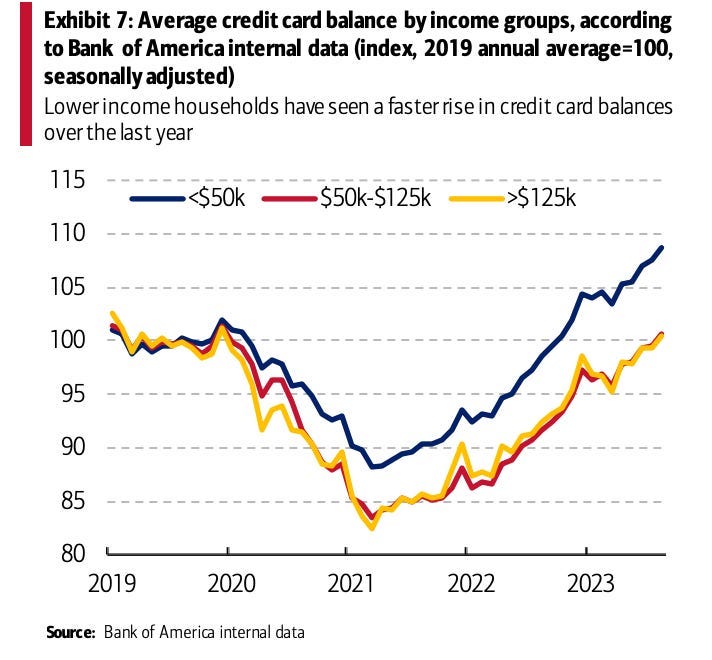
The latest reading on average credit card balances across income groups by Bank of America in August 2023 suggested that credit card balances for middle and higher-income households are at levels equivalent to that in 2019. However, credit card balances for lower-income households have seen a steeper rise and have exceeded the pre-pandemic range.
This further validates what we saw earlier, with savings depleting at the fastest rate for low to middle-income households as they face the brunt of high inflation and high rates. So, not only is this segment depleting savings at the fastest rate, but they are also increasingly tapping into credit card debt.
With the upward trend in household debt, the question arises as to whether the people (who borrow money) can pay it back.
Let’s put the record household debt into perspective
One of the metrics to assess whether household debt is growing faster than wages is to look at the household debt service payments relative to disposable personal income.
The chart below shows that household debt service payments represent 9.8% of disposable personal income. This level aligns with the pre-pandemic levels and is far below the 2008 Great Financial Crisis highs, where household debt service payments reached 13% of disposable personal income.

Generally, this would be a positive sign, suggesting that while the consumer is borrowing, they are not doing so at a rate faster than wage growth. If they did borrow at a rate faster than the rate of wage growth, debt service payments as a percentage of disposable personal income would go up, and clearly, that is not what is happening today.
But before we let our guard down, I want to bring your attention to the individual components of household debt again. Remember, household debt consists of mortgage and non-mortgage debt. While household mortgage debt service payments as a percentage of disposable income stands at 4% in Q2 2023, a level that is not alarming, non-mortgage debt, a.k.a consumer debt service payments (which consists of debt service payments for auto loans, student loans, and credit card debt) is growing at a rate of 8.5% on a year-on-year basis.

In the meantime, non-mortgage debt service payments represent 5.8% of disposable personal income today, and the number is growing. This indicates the pain inflicted on people who need to borrow to buy goods and services from rising interest rates.
As long as consumer debt service payments relative to disposable personal income grow, we can expect the US consumer to get further squeezed and slow down spending unless income grows faster. Worse, if the labor market weakens materially, followed by a drop in income levels, default risk would rise as the US consumers won’t be able to pay back the debt.
Given the current figures, disposable personal income would need to drop by 20% or more for debt service payments relative to personal income to rise to the 2008 GFC level. That is quite a bit of a cushion.
However, should a recession happen, a drop of 20% in income levels is not unprecedented. In such a circumstance, we would see consumer loans default. While the consumer loan delinquency rates are not alarming today, credit card delinquency rates stand at 2.77% and are climbing. Something to watch out for!
Closing thoughts
The US economy is not in a recession, nominal consumer spending is strong, and the labor market is resilient. The Fed continues to share a bright outlook for the economy. But things could aggressively turn in the opposite direction, as 69% of US consumers and 84% of US CEOs are preparing for a recession.
Looking forward, I will monitor the state of the labor market, the volume of revolving credit relative to disposable personal income, and the overall sentiment to assess the evolving health of the US consumer. Though the US consumer may seem healthy, it is time to take precautions before a cold or the flu arises.
Copyright 2023 by Amrita Roy. Republished with permission of the author.
Did you enjoy this guest post by Amrita Roy? Comments are open to everyone.
The Pragmatic Optimist is currently free to read. You can also tell Amrita you value her writing by pledging a future subscription.
Disclosure: Quality Value Investing by David J. Waldron’s guest writer posts are for informational purposes only. The accuracy of the data cannot be guaranteed. Narrative and analytics are impersonal, i.e., not tailored to individual needs nor intended for portfolio construction, and are presented solely for educational purposes. David and his guest writers are individual investors and authors, not investment advisers. Readers should always engage in their own research or due diligence and consider (as appropriate) consulting a fee-only certified financial planner, licensed discount broker/dealer, flat fee registered investment adviser, certified public accountant, or specialized attorney before making any investment, income tax, or estate planning decisions.





This was a helpful summary. Thanks Amrita.
Amrita Roy's insightful analysis of the US economy's current state delves into the resilience of the labor market, the dynamics of consumer savings, and the concerning rise in household debt. The juxtaposition of nominal wage growth against inflation, the impact of gig jobs on millennials and GenZ, and the disproportionate effects of excess savings drawdown across income groups paint a nuanced picture. As household debt hits record levels, especially in credit card balances for lower-income households, the potential threat to consumer well-being becomes evident. The critical question of whether consumers can pay back this rising debt is explored through the lens of debt service payments relative to disposable personal income. Roy's examination serves as a timely reminder to keep a vigilant eye on evolving economic indicators, even in the face of a seemingly robust economy. What are your thoughts on the potential risks and precautions to be taken in this economic landscape?